Close Encounters
A personal project about UFOs. The different views show how extraterrestrial sightnings have increased in the last decade worlwide.
Link:
Team and partners:
Zoe Cooper (editor)
Year:
2020
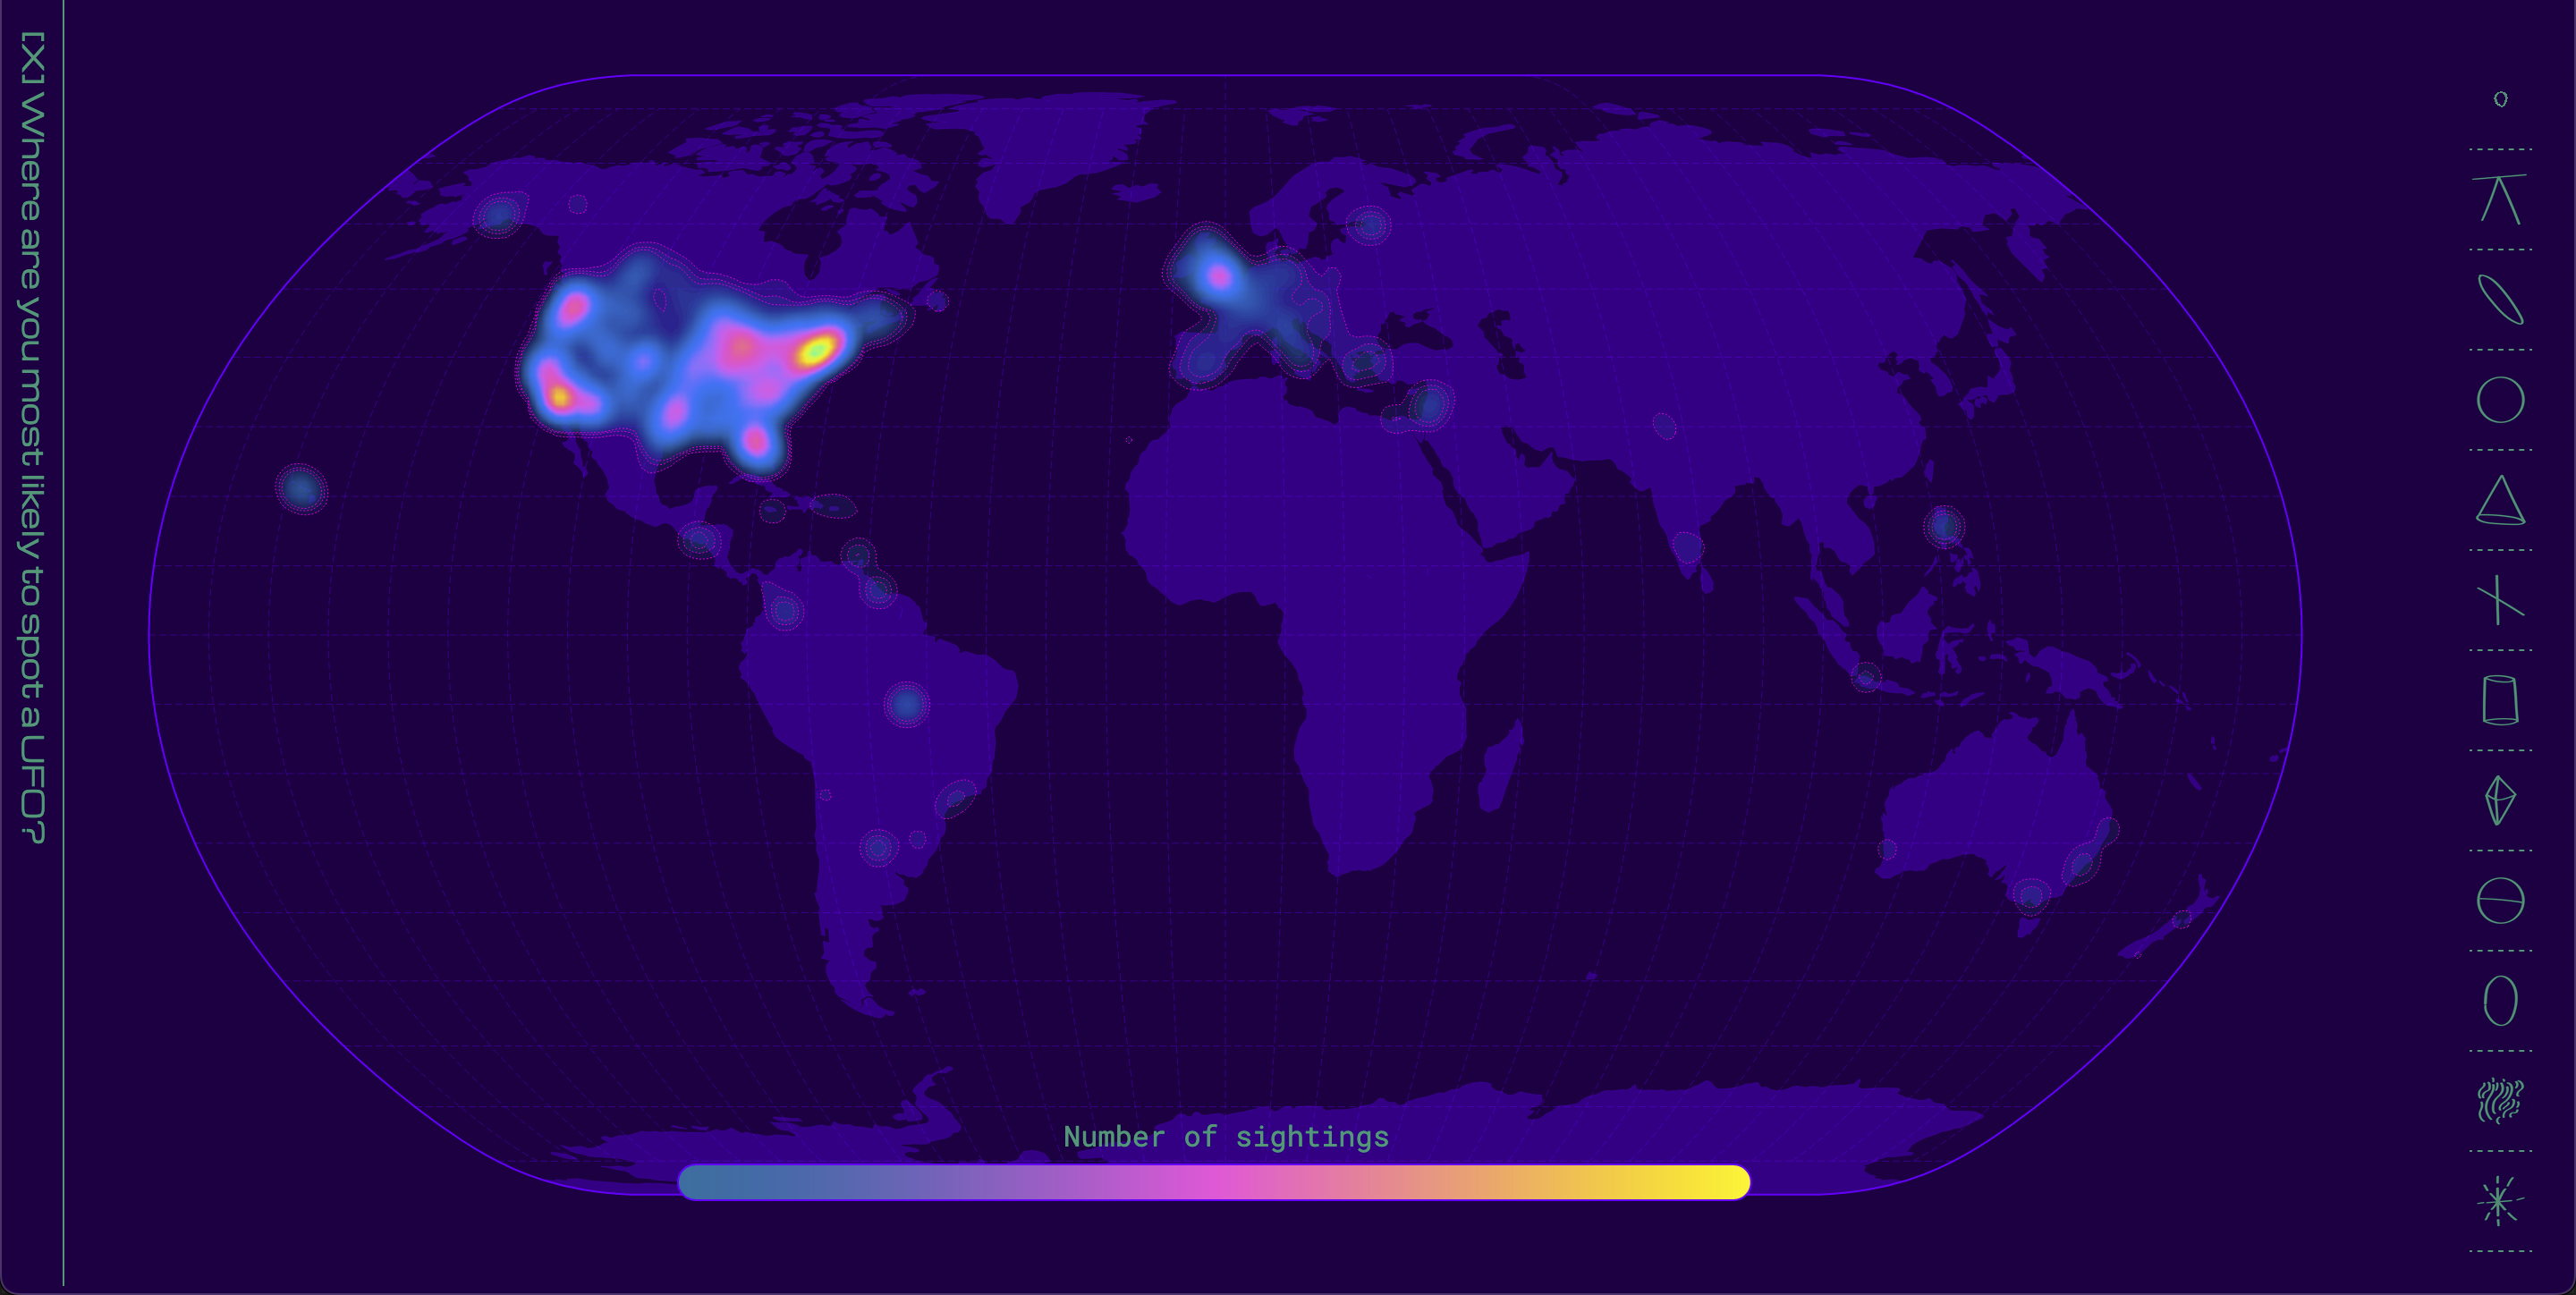
While all eyes were on the still-raging pandemic, the Pentagon quietly released their records of reported UFO sightings around the world (yes, really). The newly declassified information came on the heels of years of witness testimonies collected by the for several decades. So, in need of a little comic relief from the monotony of lockdown life, we decided to comb through the new material and see what the data might reveal! Some entries were incredibly detailed, including close descriptions of each UFO’s design, brightness, and speed. Some seemed more offhand, or vague. All of them were weird. We had so many questions. Where do these testimonies send to come from? When are they most often reported? For a broader view, we designed a , complete with glowing hotspots of supposed extra-terrestrial activity, then a timeline dating back to 2017.

One trend immediately stood out to us: reports tend to come in during holiday times, when many people feel lonely. The first lockdown in 2020 saw a sharp increase in witness testimonies and we experienced an unprecedented sense of alienation. And what began as a fun and silly project - we aren’t serious UFO believers ourselves - became a poignant reflection on the chaotic time we’re living through, when we want to believe we’re not alone.
Coupling overview and detail
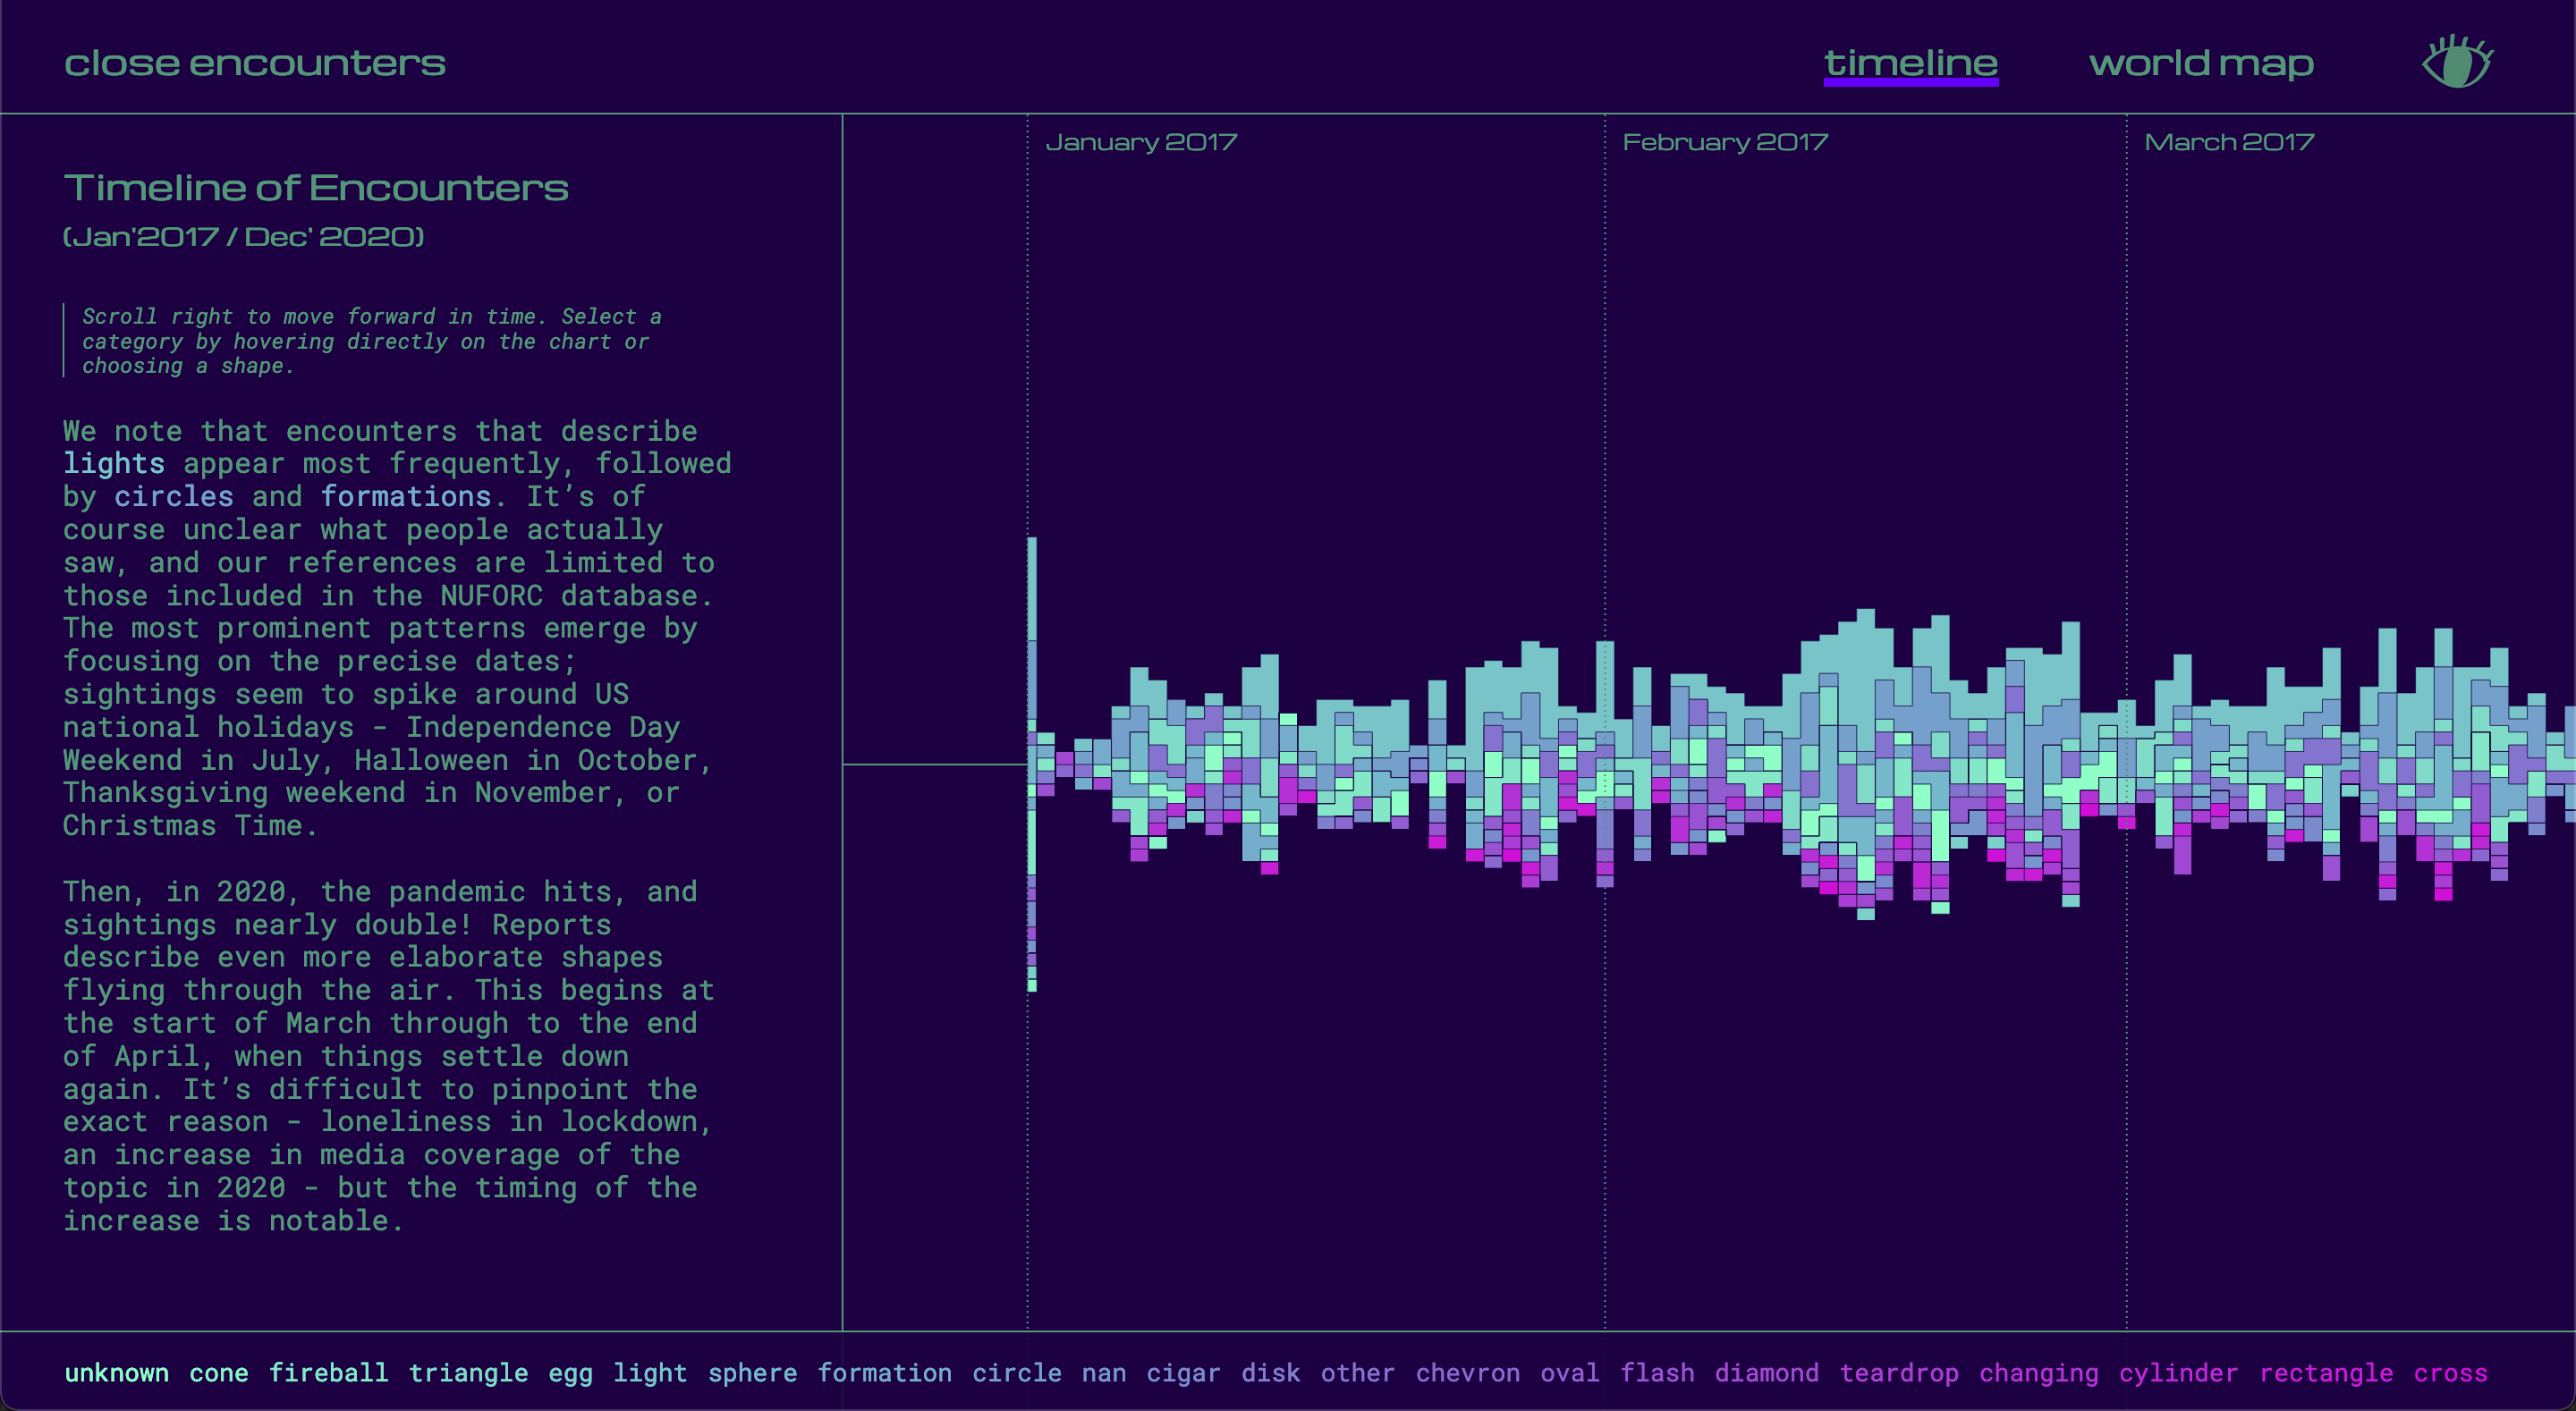
Given the large number of testimonies, we initially designed visualizations that could give the reader a quick overview of all the UFO sightings. As visible in the figures above and below, these consisted of two large visualizations: a bump chart to show the temporal development of the phenomenon and a map to display its geographical distribution.

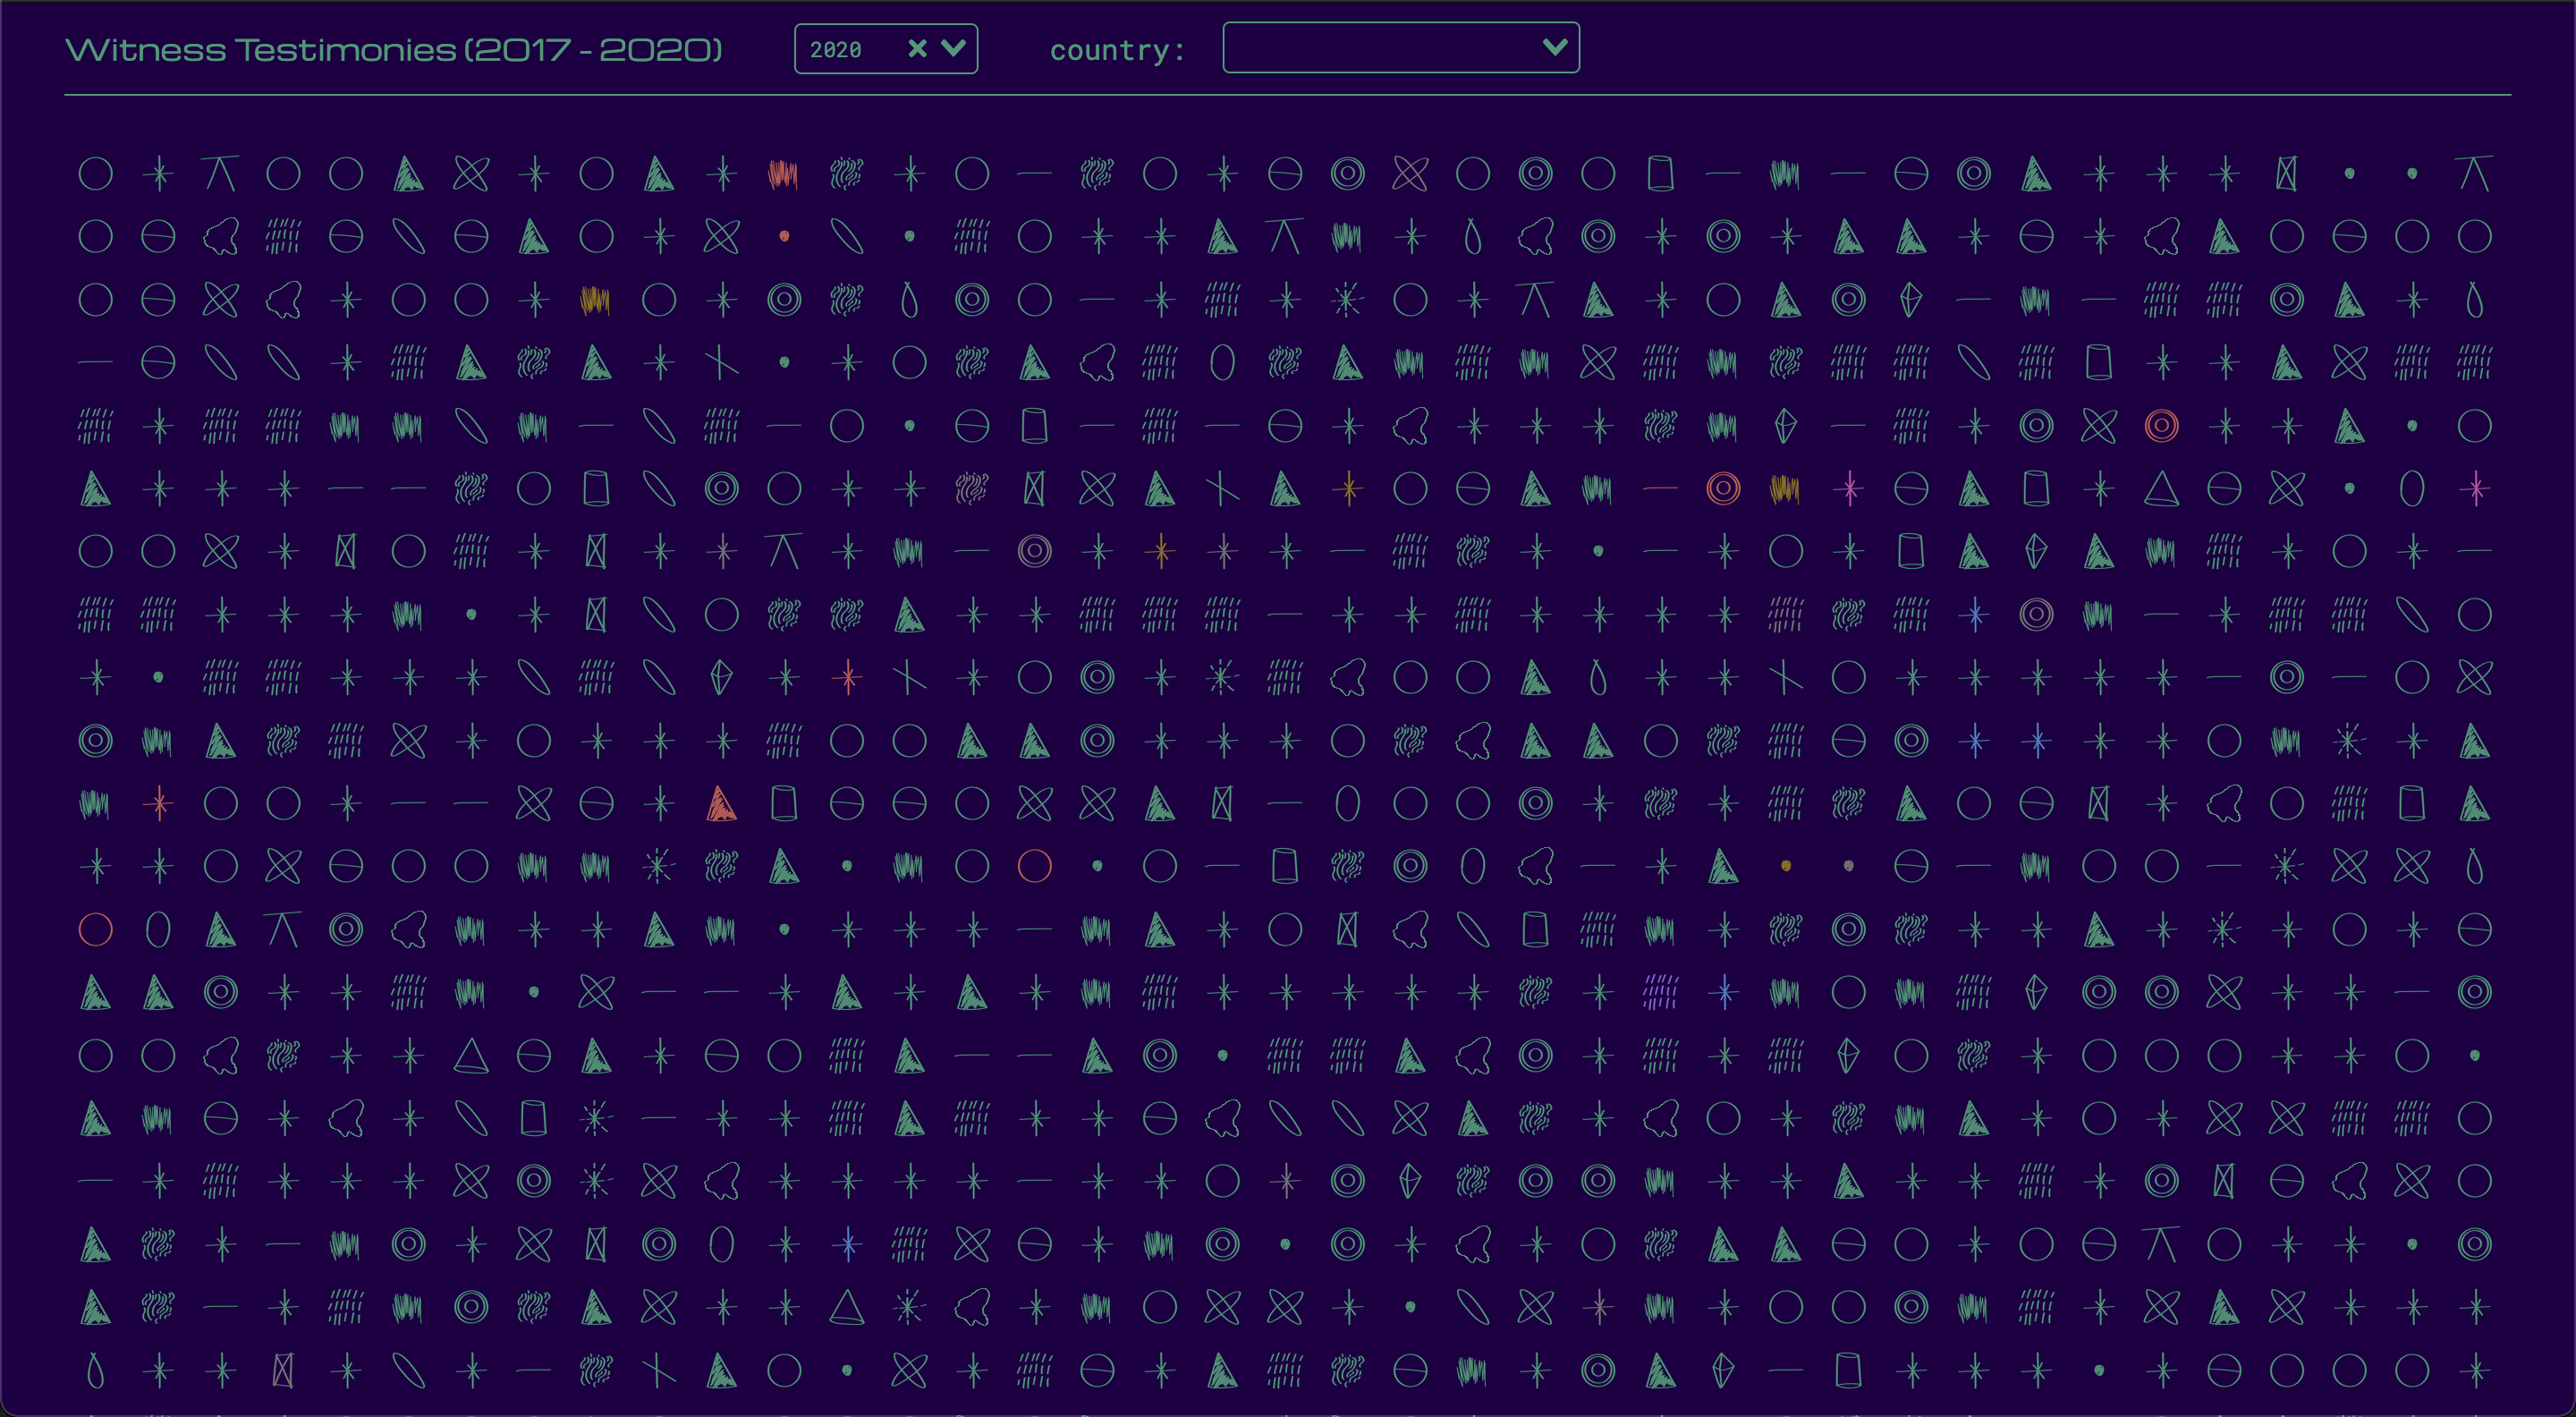
However, the self-scraped dataset – coming from NUFORC – also contained many rich textual testimonies. The individual entities have been visualized on a grid, following their temporal order and regardless of their geographic location. For each testimony, the shape of the UFO was extracted and condensed into a few categories, represented on the grid through small animated icons. As visible in the figure below, this translated into a comprehensive visual overview of all testimonies. By hovering over the individual icons, the user can read the testimony connected to the encounter.
